DewesoftX comes with many ready-made widgets: recorder, digital meter, analog meter, FFT and others. Sometimes, though, you need something that does not exist yet. For that you can write your own widget as a plugin in C++. That used to mean days of writing code. I tried how far an AI gets with the same task.
Why moving arrows
The idea came from the single line diagram. With an energy storage system, for example, the most important question is whether the battery is charging or discharging and which way the energy is flowing. With a number you have to read that from the sign; with moving arrows you see it at a glance.
Place widgets like this on the branches of a diagram in a DewesoftX display and you get a live single line diagram: each branch shows the direction and size of its current straight from the measured channel.
One sentence
The whole order was one sentence that I typed to the AI:
I would like to have visual widget for current measurement, like having a line with green arrows which side the current is moving and then nice analog meter
The result
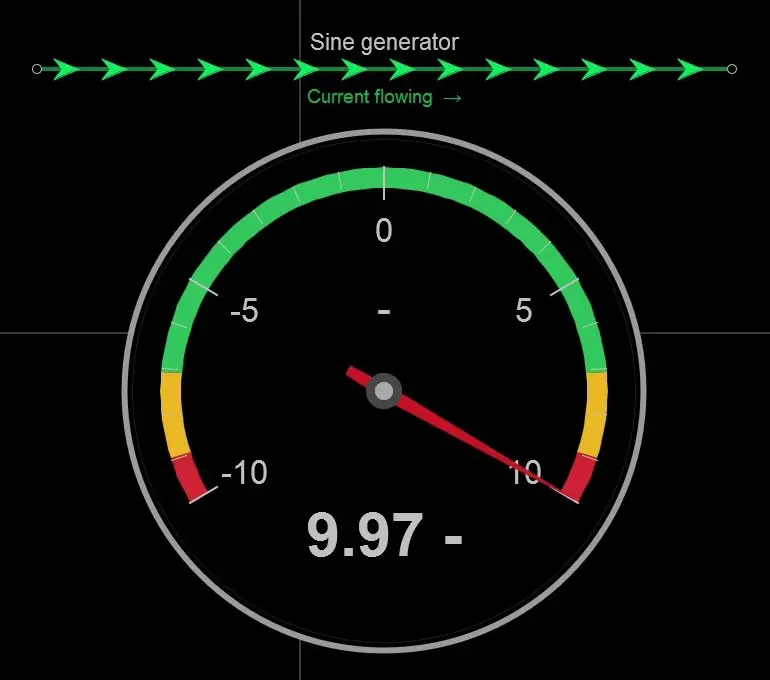
The widget in DewesoftX. The input is a sine generator from −10 to 10 with a period of 20 seconds.
The widget works in DewesoftX like any other: you can add it to a display, assign a channel to it and resize it. It has three parts:
- Header with the channel name.
- Current direction line. Green arrows move the way the current flows: the sign of the value sets the direction and its size sets the speed. When the current is close to zero, the line turns grey and shows the text “No current”.
- Analog gauge with green, yellow and red zones and a numeric readout.
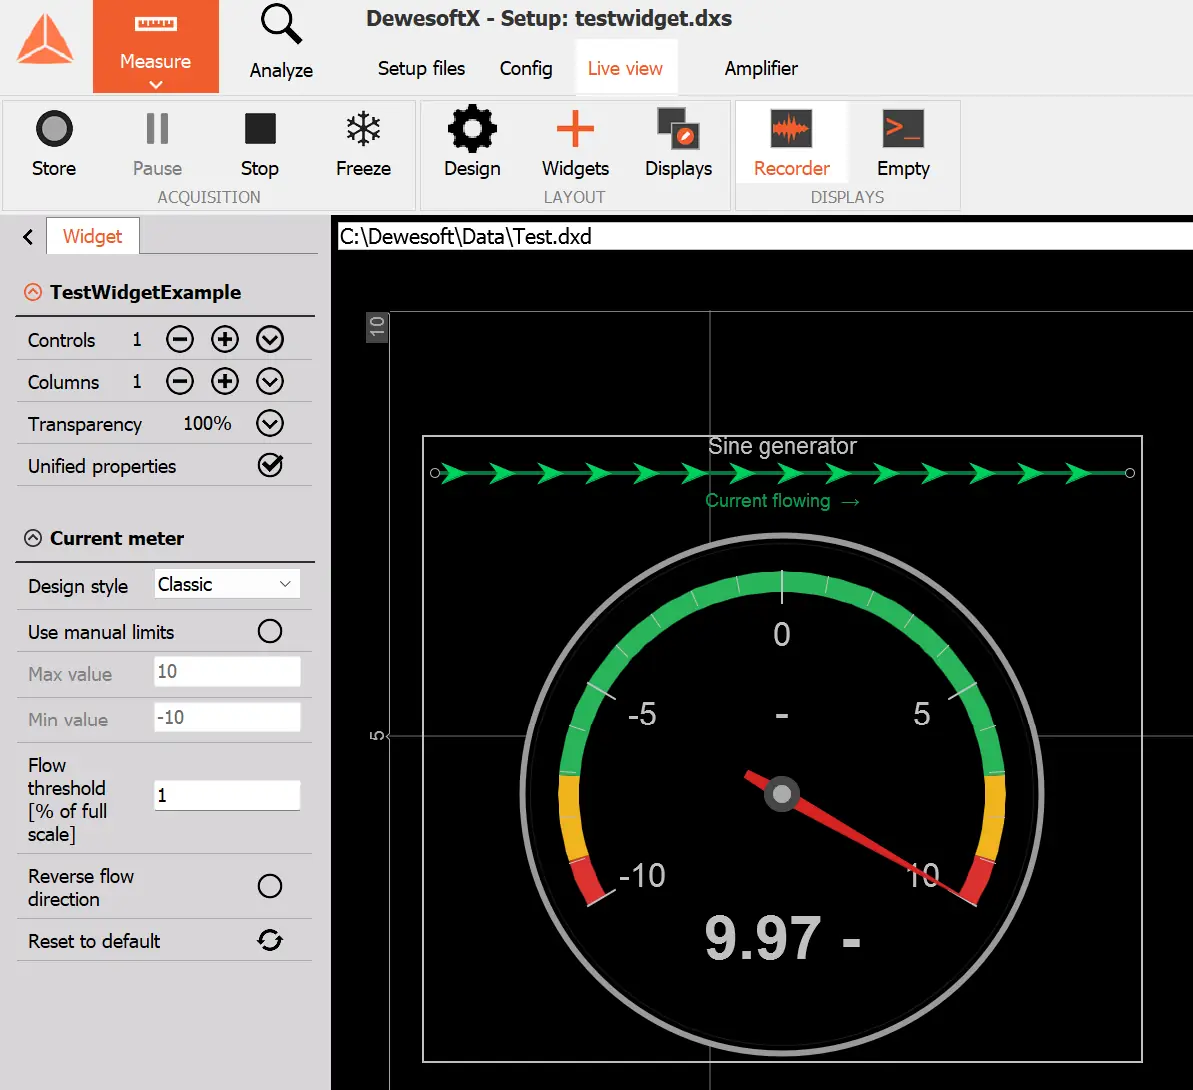
In the settings panel you can pick a design style, set the scale limits manually, change the threshold below which the current counts as zero, and reverse the flow direction.
How it went
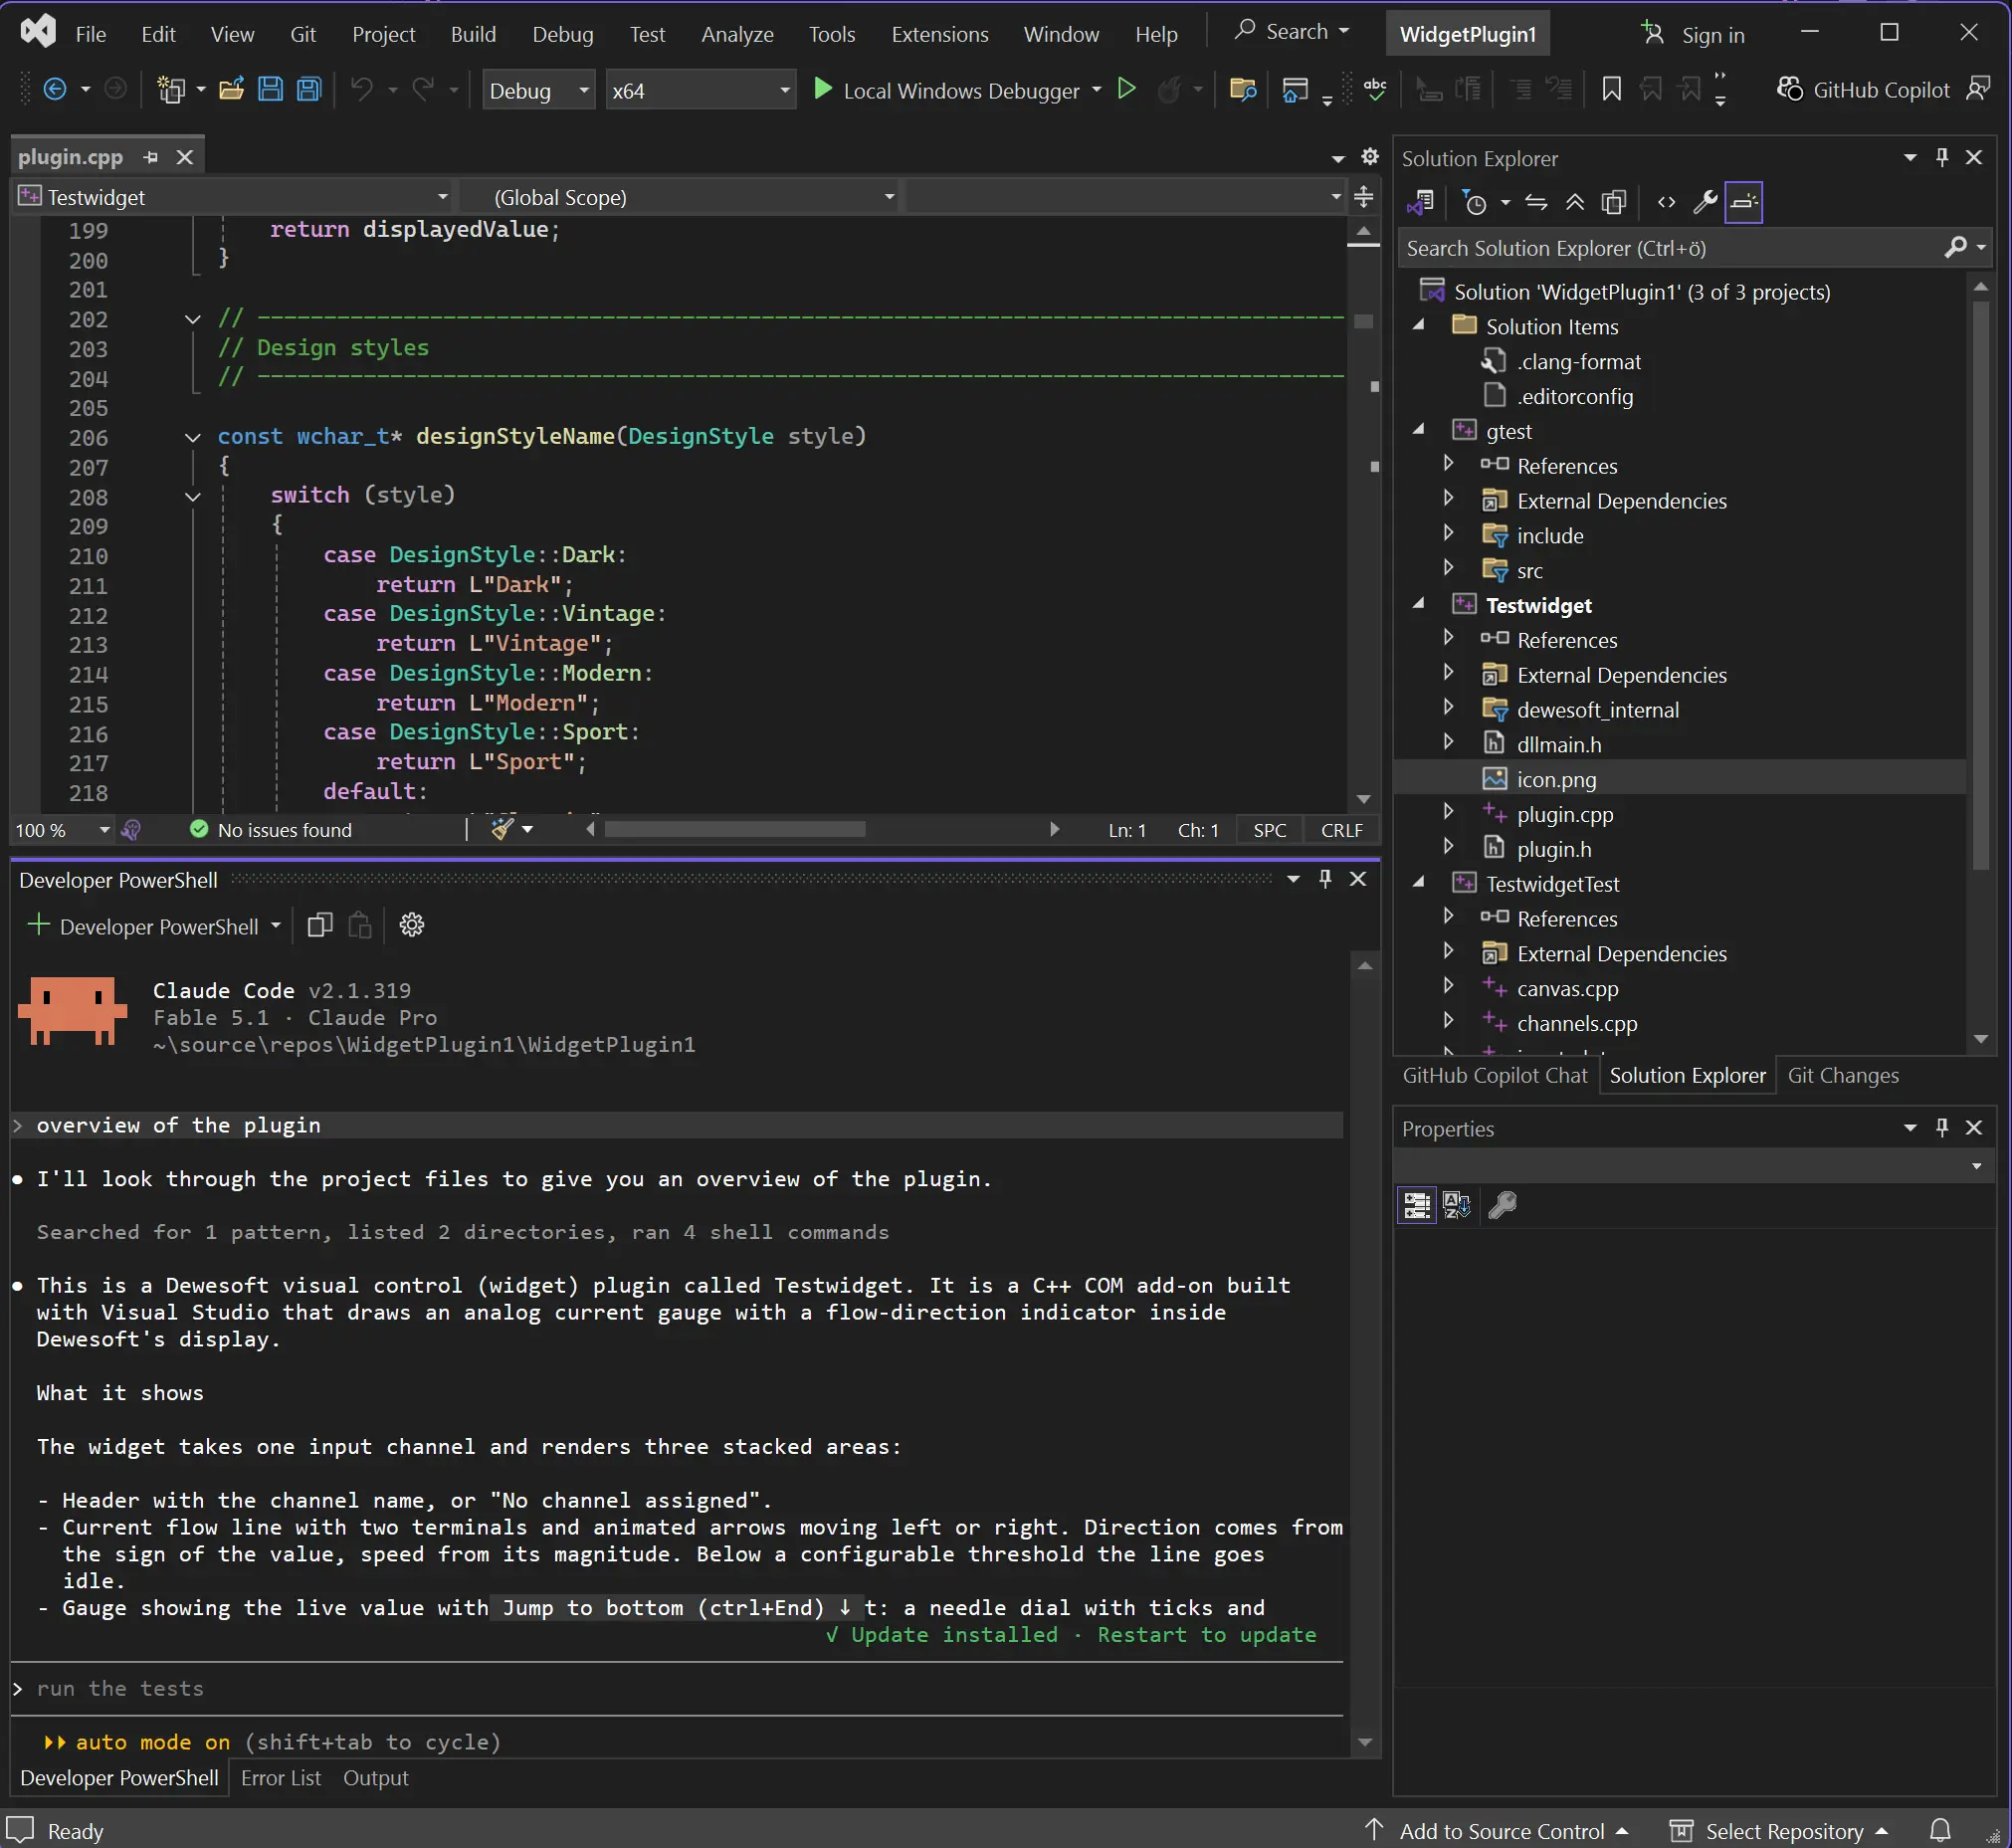
The starting point was Dewesoft’s own widget plugin template in Visual Studio. Setting it up is covered in the free Dewesoft Academy course Developing Custom Display Widget Plugins for DewesoftX Using C++.
The AI tool was Claude Code, running in the Visual Studio terminal right in the project folder. It read through the template, wrote the widget code and explained what it had done.
Changes work the same way
The widget can be developed further in the same conversation. For a single line diagram I needed a version with only the arrows, without the gauge, header and text. I asked whether that was possible:
is it possible to make version where there is only arrows and no dial or text descriptions and header
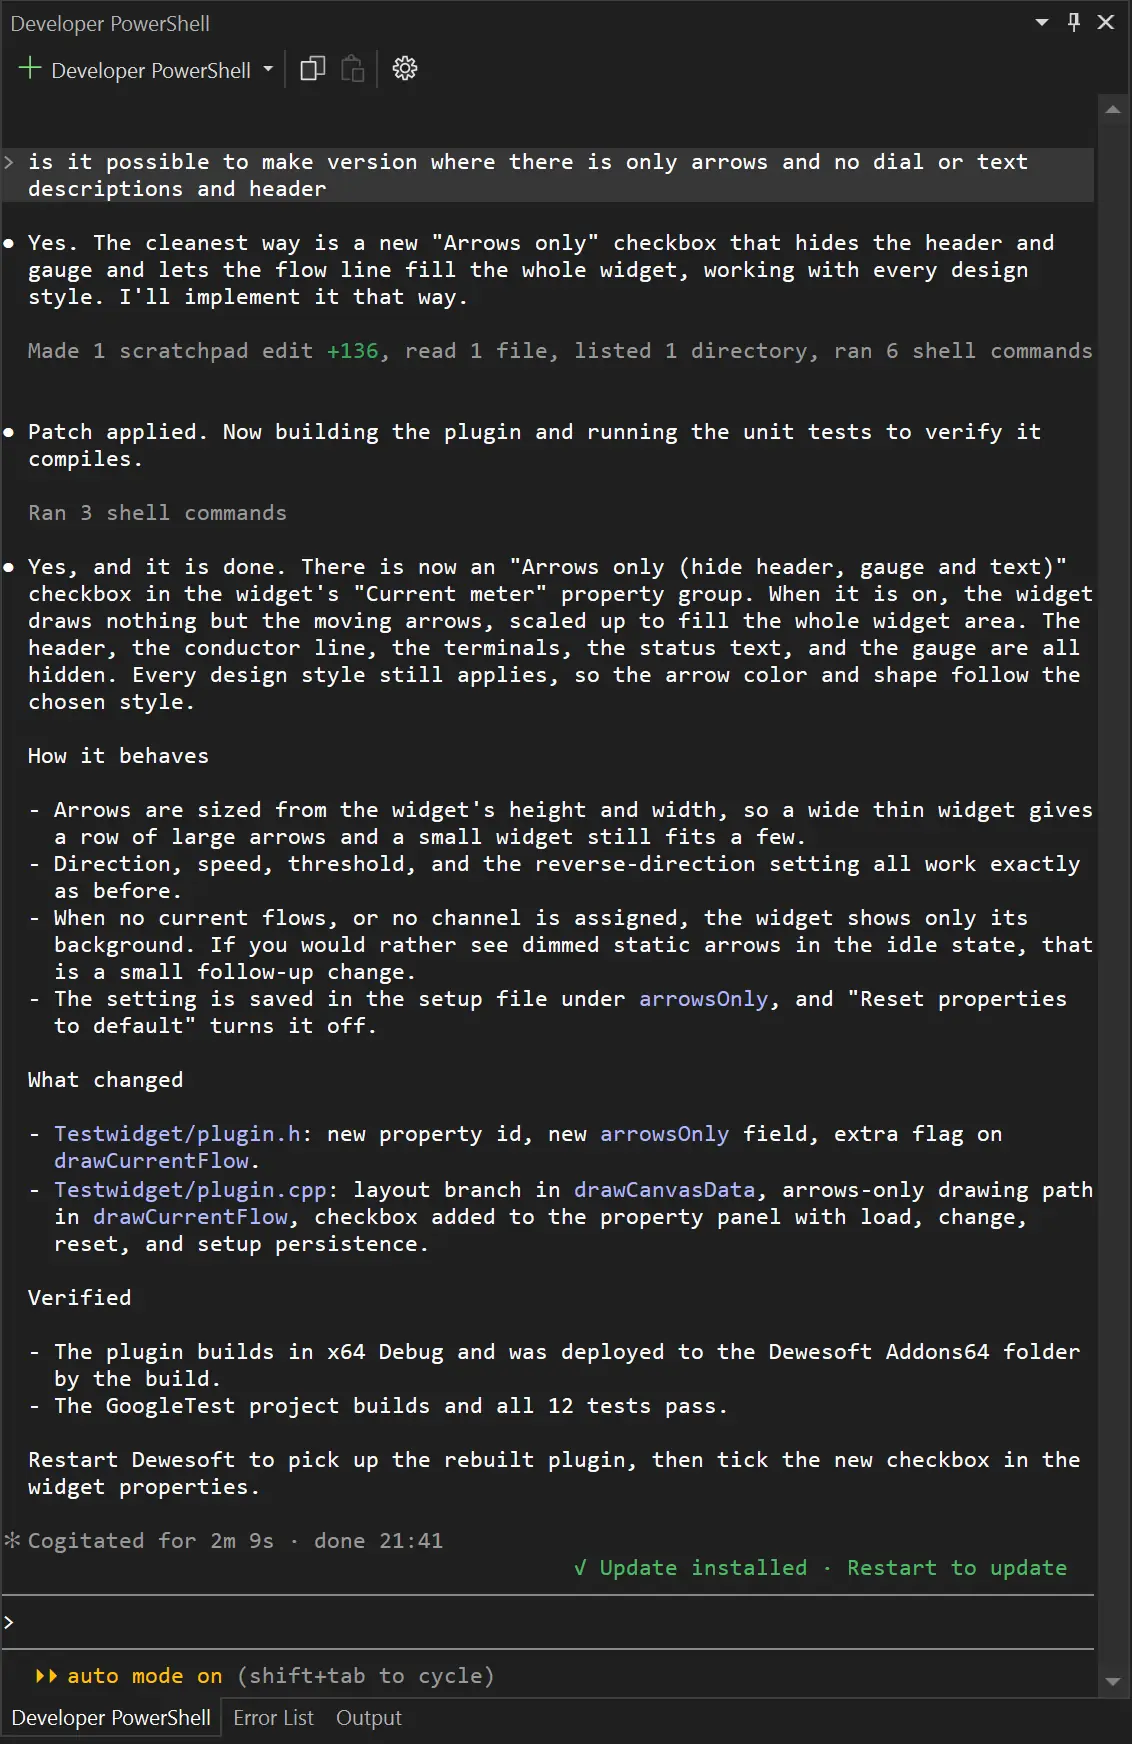
The AI added an “Arrows only” checkbox to the settings that hides everything except the moving arrows and lets them fill the whole widget area. It then built the plugin, ran the project’s 12 unit tests and deployed the new version to Dewesoft’s add-ons folder. All of that took a little over two minutes. My part was to restart DewesoftX and tick the checkbox.
What to take from this
A custom widget is no longer a big development project. Once it is clear what you want to see on the screen, you get from idea to working widget very quickly. That suits single line diagrams of energy storage and other power systems, operator views and test benches, where a standard meter does not say enough.
Two things are still left to a person:
- The project has to be set up once. You need Visual Studio and a project created from the Dewesoft template. It is a simple one-time step; from there the AI builds and deploys the plugin itself.
- The result has to be checked. Here the input was a test signal. Before a real measurement you need to make sure the widget shows the right value, the right direction and the right unit.
Read more about power and energy measurement.
Need a widget of your own or another custom solution for DewesoftX? Get in touch.